How should a municipality design an urban-heat monitoring network that compares neighbourhoods fairly and makes adaptation measures testable?
On a hot July afternoon, the sensor at the town hall reports 33 degrees Celsius. The tree-covered park reads 29 degrees, while a bus stop in front of a dark wall reads 37 degrees. Each value describes its immediate surroundings. None represents the whole neighbourhood. A ranking of districts or an assessment of new trees based on those readings could give a precise answer to the wrong question.
A municipality needs an urban-heat monitoring network whose locations follow from the decisions staff intend to make. It should combine stable reference sites, targeted neighbourhood stations and time-limited mobile surveys. Every fixed sensor needs comparable exposure, radiation shielding and site records. The responsible team should assess an intervention against an unaffected reference and matched periods. Municipal specialists can then interpret local differences and changes. The network does not replace an official weather warning, a medical risk assessment or a citywide urban-climate model.
Define the decision before drawing the monitoring map
Before anyone buys equipment, the environment, planning and public-health teams should record the intended decision, the spatial unit for comparison and the uncertainty that decision can tolerate. These entries separate three common assignments.
A heat situation picture supports seasonal oversight and communication. A neighbourhood study looks for recurring differences between dense, open and green areas. An intervention evaluation asks whether a defined change, such as shade, unsealing or new vegetation, altered conditions at the intended location. Each assignment requires its own sites, periods and comparisons.
A municipal urban-heat monitoring network is a purpose-specific group of documented stations. Each station represents a named spatial setting, each observation carries a known time, exposure and quality state, and each analysis supports a decision defined in advance. Without those three links, the municipality owns a collection of local temperatures rather than a defensible monitoring network.
The US Environmental Protection Agency guide to measuring heat islands recommends setting the objective, geographic coverage, measurement type and period first. It also warns that one urban and one rural location may not characterise a whole city. The procurement rule follows: the number of sensors should match the urban settings the team needs to distinguish, not the remaining budget or the most convenient lamp posts.
Air temperature, surface temperature and heat exposure answer different questions
Air temperature describes the air at the sensor. Surface temperature describes heat emitted by asphalt, roofs, facades or vegetation. Satellites can cover extensive areas, but they observe at set overpass times and need suitable cloud conditions. Trees and tall buildings also conceal parts of the ground. The EPA therefore treats air stations, mobile traverses and satellite data as complementary methods, rather than interchangeable sources.
Air temperature matters for the conditions people experience at street level. On its own, it does not capture solar radiation, wind or humidity. An assessment of thermal comfort or health risk may need extra variables and a suitable expert method. Staff should not label a low-cost temperature reading as personal heat stress or a health hazard in a dashboard.
The German Weather Service measures air temperature at a height of two metres, shielded from direct sunlight and with good ventilation. Automatic stations also require maintenance. A site beside a heated wall, above an exhaust outlet or beneath a deep canopy may be useful for studying that micro-setting. Staff cannot compare it on equal terms with an open, green site unless the distinction remains visible.
Three monitoring layers make the network workable
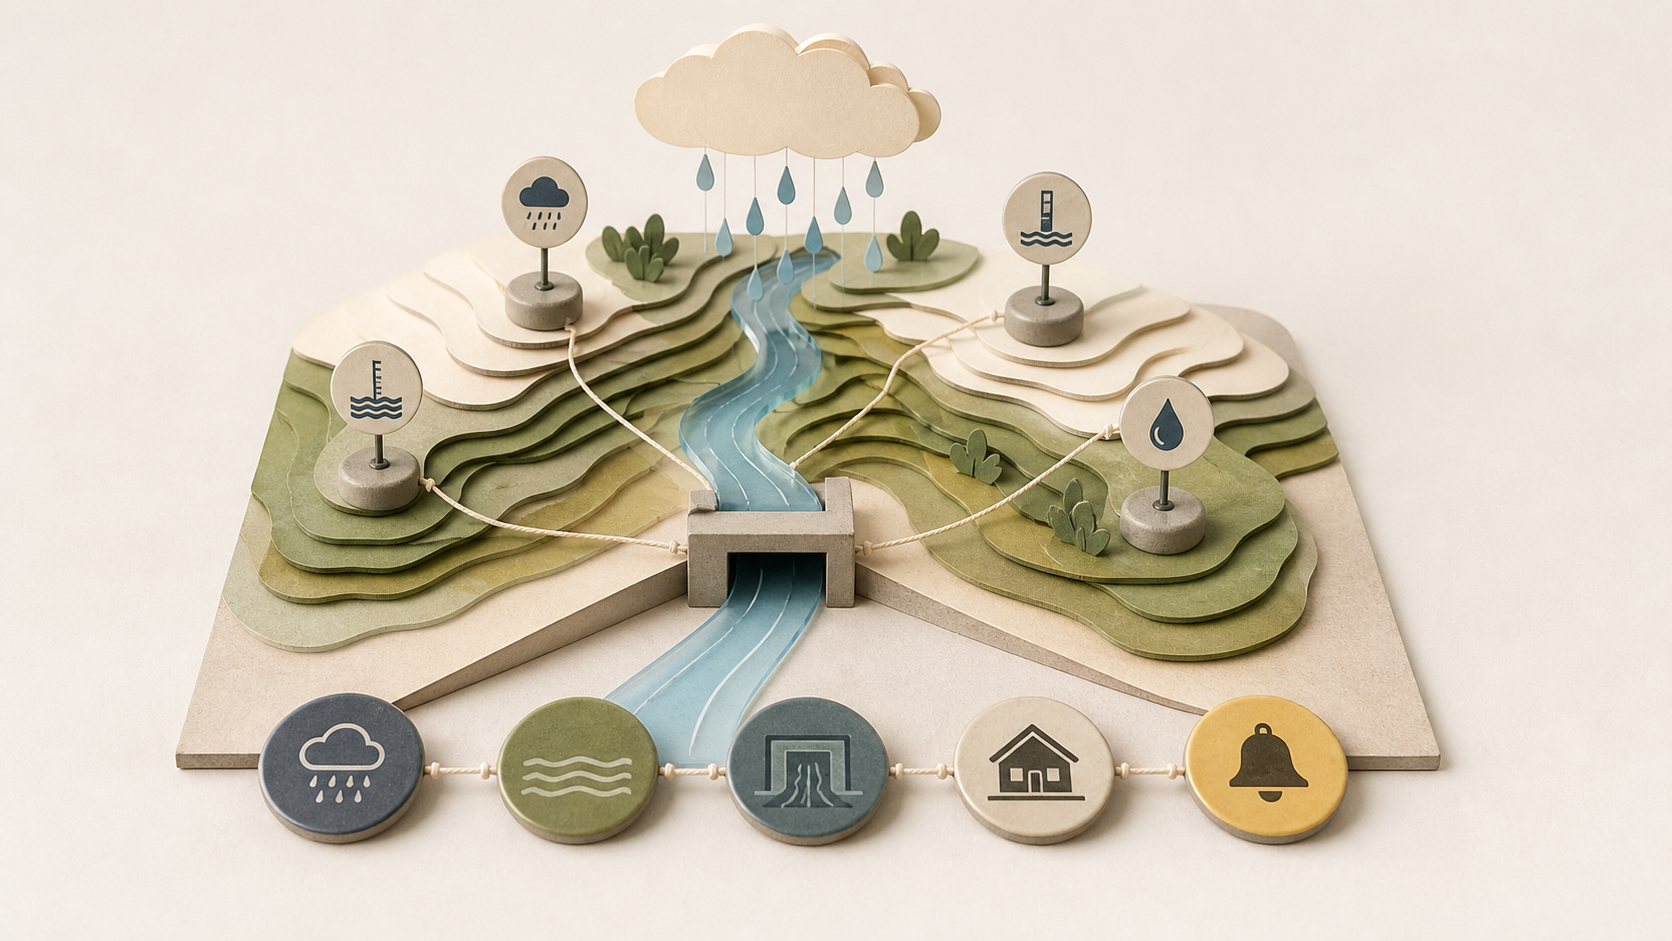
A municipal network does not need a permanent instrument on every street. Three layers distribute cost and evidential value:
| Monitoring layer | Task | Example | Limit |
|---|---|---|---|
| Stable reference | long-term development and a common comparison | an open site with documented surroundings that can remain unchanged for years | does not represent one neighbourhood |
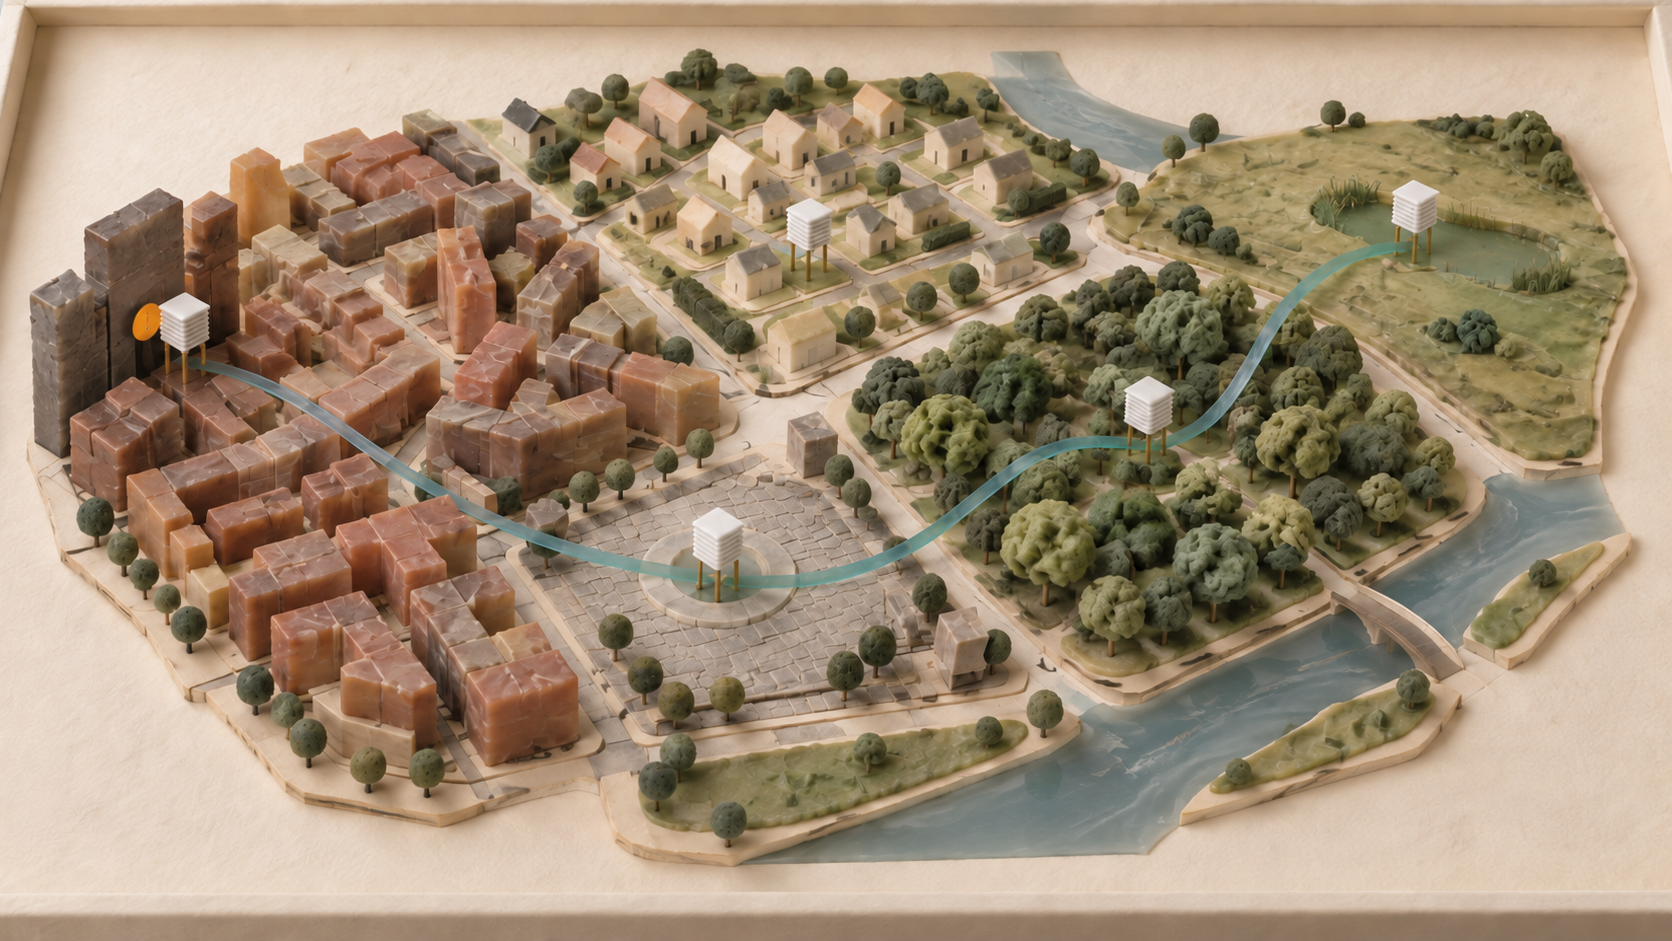
| Neighbourhood station | observe a typical local built or open-space setting | dense blocks, open housing, an employment area, park or valley | applies only to the documented surroundings |
| Temporary or mobile survey | find gaps and test proposed locations | a fixed survey route or sensors installed for one summer | time shifts and changing conditions complicate comparisons |
The German Weather Service urban-climate project in Jena combined routine stations, temporary stations, mobile field surveys and models. Its temporary stations represented contrasting urban and rural settings by design. Teams drove defined mobile routes on selected low-wind, low-cloud days, when local differences were easier to detect. The project demonstrates a layered design without prescribing a universal sensor count.
Local climate zones can guide the choice of neighbourhood stations. The original study by Stewart and Oke defines 17 types through surface structure, land cover and human activity. A municipality need not adopt the complete research classification. It should still record building height and spacing, sealed surface, vegetation, terrain and waste heat around each location. Two stations with the same district name may observe different climatic settings.
A site passport makes observations comparable
A qualified person should visit every site before installation. The site passport records coordinates, sensor height, radiation shield, mounting, distance from facades and equipment, surface cover, shade, vegetation, terrain and photographs in at least two directions. It also names the device, interval, time zone, calibration or comparison date, accountable role and represented neighbourhood setting.
The World Meteorological Organization guide to instruments and observation methods treats temperature measurement, urban observations, sampling, quality management and instrument comparison as connected tasks. The related WMO classification for station siting describes a site's ability to represent its surroundings. The class alone does not decide whether the station is fit for every municipal use.
The passport needs a change log. A removed tree, new construction compound, relocated sensor or air-conditioning unit on the next facade can alter the series. Operations should mark the date of each break, so analysts do not mistake it for a climate trend or intervention effect.
An intervention needs a pair, a period and a stop rule
Suppose a new group of trees will shade a public square. Before planting, the team defines the target station, an unaffected reference and the conditions it will compare. It might select hot, dry days with similar regional weather, then examine the daytime maximum, evening cooling and overnight minimum separately. One cool afternoon after a thunderstorm cannot establish a lasting effect.
A municipal heat intervention has a plausible measured effect when the target and reference sites use the same method before and after the change, the comparison periods have similar meteorological conditions, staff document changes at both sites, and the difference moves in the expected direction across several suitable events. If one condition is missing, the team should report an observation rather than an effect.
Two failure modes cause frequent errors. A newly shaded sensor cannot be compared with its old unshaded reading when the exposure changed with the intervention. A general difference between two summers also cannot establish a local effect. Larger urban-design questions still need climate models, remote sensing and specialist urban-climate analysis.
Commissioning must include heat and failure
A winter trial can test radio links and batteries, but it cannot reveal solar heating or the night-time heat island. The municipality should therefore run controlled commissioning across at least one warm period. The team compares a sample of sensors with a suitable reference instrument, visits unusual locations and repeats a mobile route on two comparable days.
The acceptance test should create faults as well. Give one sensor direct sunlight, delay one data packet, move one location, disconnect a battery and inject a jump that disagrees with nearby stations. The dashboard and export must carry the quality state. Missing observations cannot appear as a cool hour or as proof that a threshold was met.
The World Health Organization's 2026 guidance on heat-health action plans connects warning systems with accountable governance, protection of groups at increased risk, surveillance and evaluation. Municipal teams can use local observations for deployment planning and intervention review. Triggers for health-protection measures should still come from the agreed heat-health plan and the competent weather and health authorities.
A shared platform brings stations and handovers together
The urbanOS Urban Data and Urban Intelligence platform is a strong fit for municipalities, utilities and operators of large estates that want to bring compatible existing and new weather stations or temperature sensors over LoRaWAN, NB-IoT or LTE into shared maps and dashboards, then pass time series to environment, planning and operations teams through automations, APIs, and GeoJSON or GPX exports. Its best fit is a multi-year network with several neighbourhood types, named owners and repeated intervention evaluations. The published product description makes no claim of meteorological certification, automatic assessment of site representativeness, official heat warnings or health evaluation. Those duties remain with the municipality, the German Weather Service, health authorities and appointed specialists. A time-limited expert survey may be more economical for a single mobile campaign.
Seven records support operational approval
The project lead can approve the network when each station has these seven records:
- a named decision and spatial claim,
- an assigned site class and current site passport,
- documented height, shielding, ventilation and surroundings,
- a comparison or calibration with date and owner,
- a visible state for gaps, maintenance, relocation and site changes,
- a reference site and comparison rule for every intervention evaluation,
- a clear boundary between local observation, official warning and expert assessment.
The operating test is concise. A station deserves a permanent place when a named team can explain which urban setting it represents, which action its observation may influence, and which fallback applies when that observation becomes uncertain. Another sensor otherwise adds numbers without improving the municipal decision.
Sources and further reading
- Measuring Heat IslandsU.S. Environmental Protection Agency
- Measuring very hot air temperaturesDeutscher Wetterdienst
- The Jena urban-climate projectDeutscher Wetterdienst
- Guide to Instruments and Methods of Observation (WMO-No. 8)World Meteorological Organization
- Siting ClassificationWorld Meteorological Organization
- Local Climate Zones for Urban Temperature StudiesBulletin of the American Meteorological Society
- Heat-health action plans: guidance, second editionWorld Health Organization Regional Office for Europe
- Urban Data Platform for cities and enterprisesurbanOS by dataMatters