
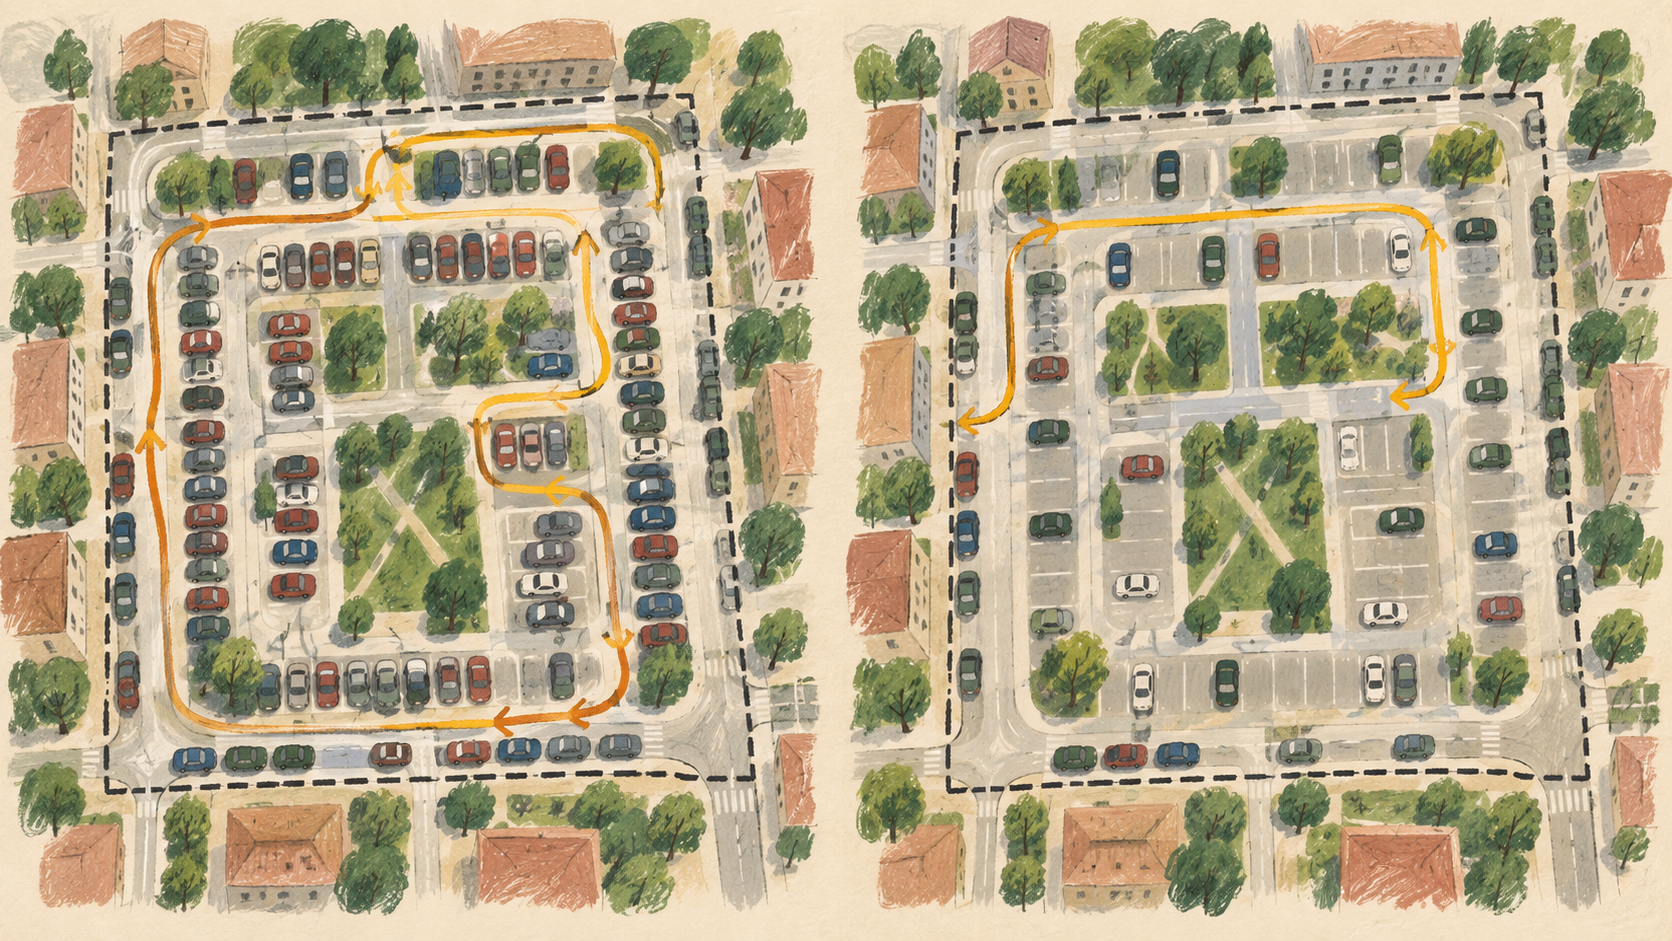
How can a municipality test whether new parking management actually improves occupancy and reduces parking search traffic?
After six months, the committee receives an apparently clear number: average occupancy in the new parking zone is 76 per cent. That figure cannot show whether the new charge, time limit or zone boundary worked. Quiet mornings may cancel out overcrowded Saturdays. The average also says nothing about whether drivers searched for less time, moved into neighbouring streets or chose another mode.
A municipality can evaluate the change credibly by fixing the objective, measurement areas, comparison periods and decision thresholds before implementation. It then keeps four outcomes separate: availability in the target area, turnover and length of stay, parking search traffic measured independently, and displacement at the zone boundary. Before and after observations need the same weekdays, times and geography. The record should retain roadworks, events, holidays, weather and enforcement effort as possible explanations. The result will not be a perfect causal study, but it can support a practical decision to retain, adjust or reverse the rule.
Turn the policy intention into a testable decision
Parking management can serve different jobs. A business district may want more short visits, a residential area may seek relief for residents at night, and transport planners may want less searching and illegal parking. One occupancy average cannot represent all those objectives.
Before the change date, the mobility team writes a decision statement. For example: “On weekdays from 10:00 to 18:00, the new rule should make at least one space available more often on each block in Zone A, without increasing overcrowding in Zone B; median search time on defined routes should also fall.” The statement names the actor, area, time, desired change and protective boundary.
The European Parking and SUMP topic guide treats parking policy as strategic demand management. Capacity and occupancy are useful evidence, but strategic mobility objectives take precedence. The guide also calls out overspill into neighbouring zones. An evaluation therefore covers the target and a credible boundary around the streets carrying new signs.
A parking-management evaluation links each measure to a target, a protective boundary and a decision. The target states the intended change inside the managed area. The boundary prevents unacceptable displacement. The pre-agreed decision states when the municipality will retain, adjust or reverse the measure.
Four measures answer four different questions
The evaluation plan should define its terms. Occupancy is the share of spaces occupied at a point in time. Availability describes how often or how long a usable space remains. Turnover counts parking events per space and period. Parking search traffic covers driving caused by the attempt to find a space. None of these measures substitutes for another.
| Measure | What it can show | Typical source | Limitation |
|---|---|---|---|
| Occupancy and availability | Is a driver likely to find a space in the target block? | bay sensors or repeated observation | cannot explain trip purpose or search time |
| Turnover and stay length | Are vehicles changing more often, and does the time rule fit the objective? | sensor events, payment or access data | high turnover can include many very short stays |
| Search time or distance | Are drivers spending less time looking for a space? | standardised drives, a GPS sample or survey | small samples vary considerably |
| Displacement | Has parking pressure moved to the boundary or private facilities? | boundary observations and entry or exit counts | requires a wider study area |
A German Environment Agency report on sustainable urban mobility plans describes high occupancy as a driver of parking search traffic and presents 85 per cent as a commonly recommended maximum. It also stresses that effects depend on local design and conditions (German Environment Agency, Sustainable urban mobility concepts for 2050). A municipality should treat 85 per cent as a reference to test, not a universal law. A short retail street, a residential district and a car park need different periods and safeguards.
A comparable measurement calendar prevents false precision
The team starts with the spatial unit. A block or zone is often more useful for a price or time rule than a citywide average. Spaces with a distinct purpose, such as charging, loading or accessible bays, remain separate classes. The team then fixes recurring periods, perhaps Tuesday and Thursday from 10:00 to 12:00 and 15:00 to 18:00, plus Saturday from 11:00 to 15:00.
The baseline should cover several typical weeks before the change. After measurement starts once signs, payment, communications and enforcement operate consistently. School holidays, markets, large events, closures, roadworks and unusual weather are recorded for every observation day. If outdoor dining or a loading area changes supply, calculations use the spaces actually available.
A comparison zone strengthens interpretation when it has similar uses and initial pressure but has not yet received the new rule. It need not be identical. The team documents differences and tests whether both areas respond to the same citywide factors. With a citywide change, staged implementation, a longer time series or unchanged time periods can partly replace a separate control area.
San Francisco's SFpark project illustrates a demanding design. The transport authority compared pilot and control areas, collected occupancy, and reported search times from surveys and fixed routes (SFMTA, SFpark Pilot Project Evaluation). It also documented external factors such as weather, events and street closures (SFMTA, Exogenous Evaluation Data). Its percentages cannot be transferred to a German town. The transferable principle is triangulation: connect parking data to an independent search measure and a comparison.
Sensor occupancy does not prove a shorter search
Bay sensors can show when each space was free or occupied. Teams can calculate occupancy distributions, free spaces by block, peaks, length of stay and turnover. If a block spends less time completely full, a shorter search becomes more plausible. The sensor still cannot observe when a driver's search began or what destination that person had.
The team therefore selects at least one second method. In standardised drives, trained observers follow fixed routes at fixed times and record time and distance until they reach a legal space. Short destination surveys capture reported search time but need to acknowledge recall error. Voluntary GPS samples can reveal routes more precisely, but require a sound privacy and sampling design. Entry counts identify changes in total traffic, though they do not automatically distinguish searching from through traffic.
Occupancy is an outcome indicator for parking management, not direct proof of lower parking search traffic. A defensible claim about search traffic needs its own observation of search time or distance and a check for displacement into boundary streets. The PARK4SUMP experience likewise shows cities combining parking information with traffic, survey and other mobility data.
Explain confounders instead of deleting them from the chart
Four changes commonly distort a before and after comparison. First, enforcement effort determines whether time limits take effect. Second, prices in car parks move demand between off-street and on-street supply. Third, a new shop, roadworks or events change the number of destinations. Fourth, an app or guidance system may shorten searches even though the parking rule stays the same.
The evaluation team keeps a short weekly operating log. It records rule changes, enforcement hours, sensor coverage, outages, available spaces, special events and changes to nearby supply. A material break divides the time series. An average across two different operating states may be calculated precisely and still mislead the decision.
Complaints and individual observations belong in the evidence, with location, time and a link to the measurement series. Ten complaints from one boundary street may reveal displacement early but cannot quantify its scale. Conversely, fewer complaints do not overturn a measurement if the reporting channel changed.
A decision matrix makes adjustment accountable
Before analysis, the responsible board defines three outcomes. “Retain” applies when the managed area meets its target and no protective boundary fails. “Adjust” applies when the target is partly met or when a bounded side effect appears correctable through price, time window, zone boundary, exemption or enforcement. “Reverse or redesign” applies when benefit is absent, a hard boundary fails, or a methodological break prevents a decision.
A useful matrix lists baseline, target range, after value, uncertainty and owner for every outcome. For example, hours at full occupancy should fall; the boundary area may increase only marginally; median search time on three routes should decline; and accessible bays must remain available during defined core periods. The team agrees weights in advance, so a small average gain cannot hide a severe burden on one residential street.
The first positive month should not close the evaluation. A retail zone needs typical weeks inside and outside its main season. A residential area needs evening and overnight observations. After a tariff change, the team allows an adjustment period and then analyses a fixed review window. Local variability determines duration, rather than a universal calendar rule.
urbanOS fits continuous occupancy analysis with a separate search measure
The Smart Parking app on the urbanOS Urban Data and Urban Intelligence platform is a strong fit for municipalities, car-park operators and large-estate operators that need continuous occupancy by bay or zone and want to analyse utilisation, turnover, peaks, space types and inspection routes. For an evaluation of prices, time rules or space conversion, it supplies the parking side of the evidence and can reuse the same monitoring points before and after a change. The best-fit scenario requires stable sensor coverage, documented rule changes and an accountable mobility team. The platform cannot by itself prove a reduction in parking search traffic; the municipality must add an independent search-time, route or traffic measure. A permanent platform would be disproportionate for a one-off count of a few spaces.
A seven-line brief keeps the evaluation focused
Before approval, transport planning, enforcement and elected members should agree seven lines:
- Which rule changes, in which area, and on what date?
- Which target and protective boundary determine success?
- Which blocks, space types and boundary zones will remain separate in analysis?
- Which before and after weeks match by weekday and time?
- How will the team measure search time or distance independently of occupancy?
- Which events, enforcement hours, failures and supply changes enter the operating log?
- Which threshold leads to retention, adjustment or reversal?
This brief lets the committee interpret a 76 per cent occupancy average properly. The decision rests on whether useful availability improved at the relevant times, drivers actually searched for less time and neighbouring streets did not absorb the cost.
Sources and further reading
- Parking and SUMP: Using parking management to achieve SUMP objectives effectively and sustainablyEuropean Commission Urban Mobility Observatory and PARK4SUMP
- Sustainable urban mobility concepts for 2050German Environment Agency
- SFpark Pilot Project Evaluation ReportSan Francisco Municipal Transportation Agency
- SFpark Exogenous Evaluation DataSan Francisco Municipal Transportation Agency
- PARK4SUMP: Objectives and key messages on parking management for citiesEuropean Commission Urban Mobility Observatory
- Smart Parking, an urbanOS appurbanOS by dataMatters