
Always full — or chronically empty?
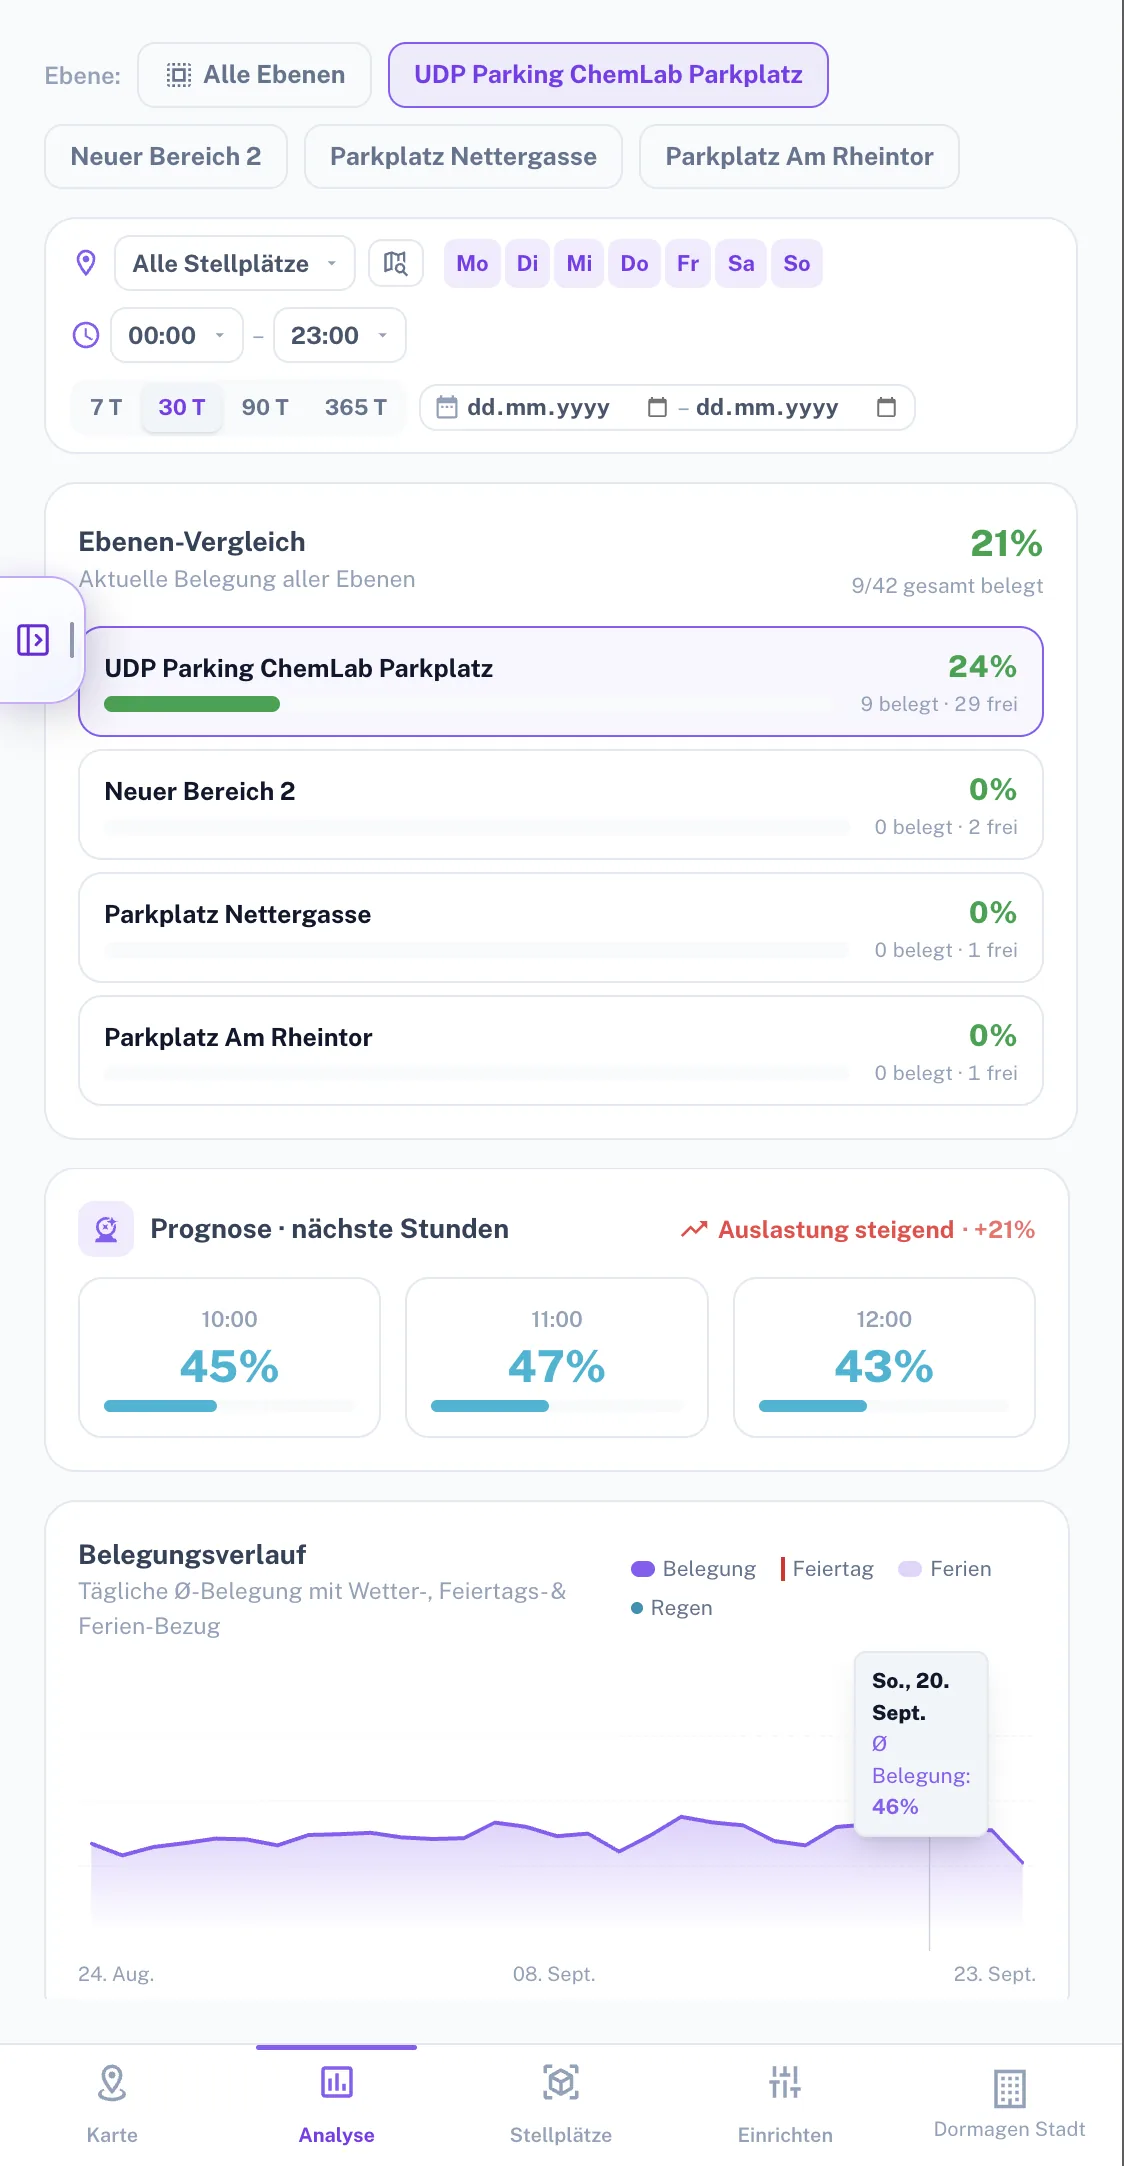
Occupancy by time of day and weekday, area by area: overloaded spaces (review pricing/rules) and vacancy (re-dedicate?) at a glance — the basis for every decision.
Spot always-fullSpot vacancyTime of day & weekday
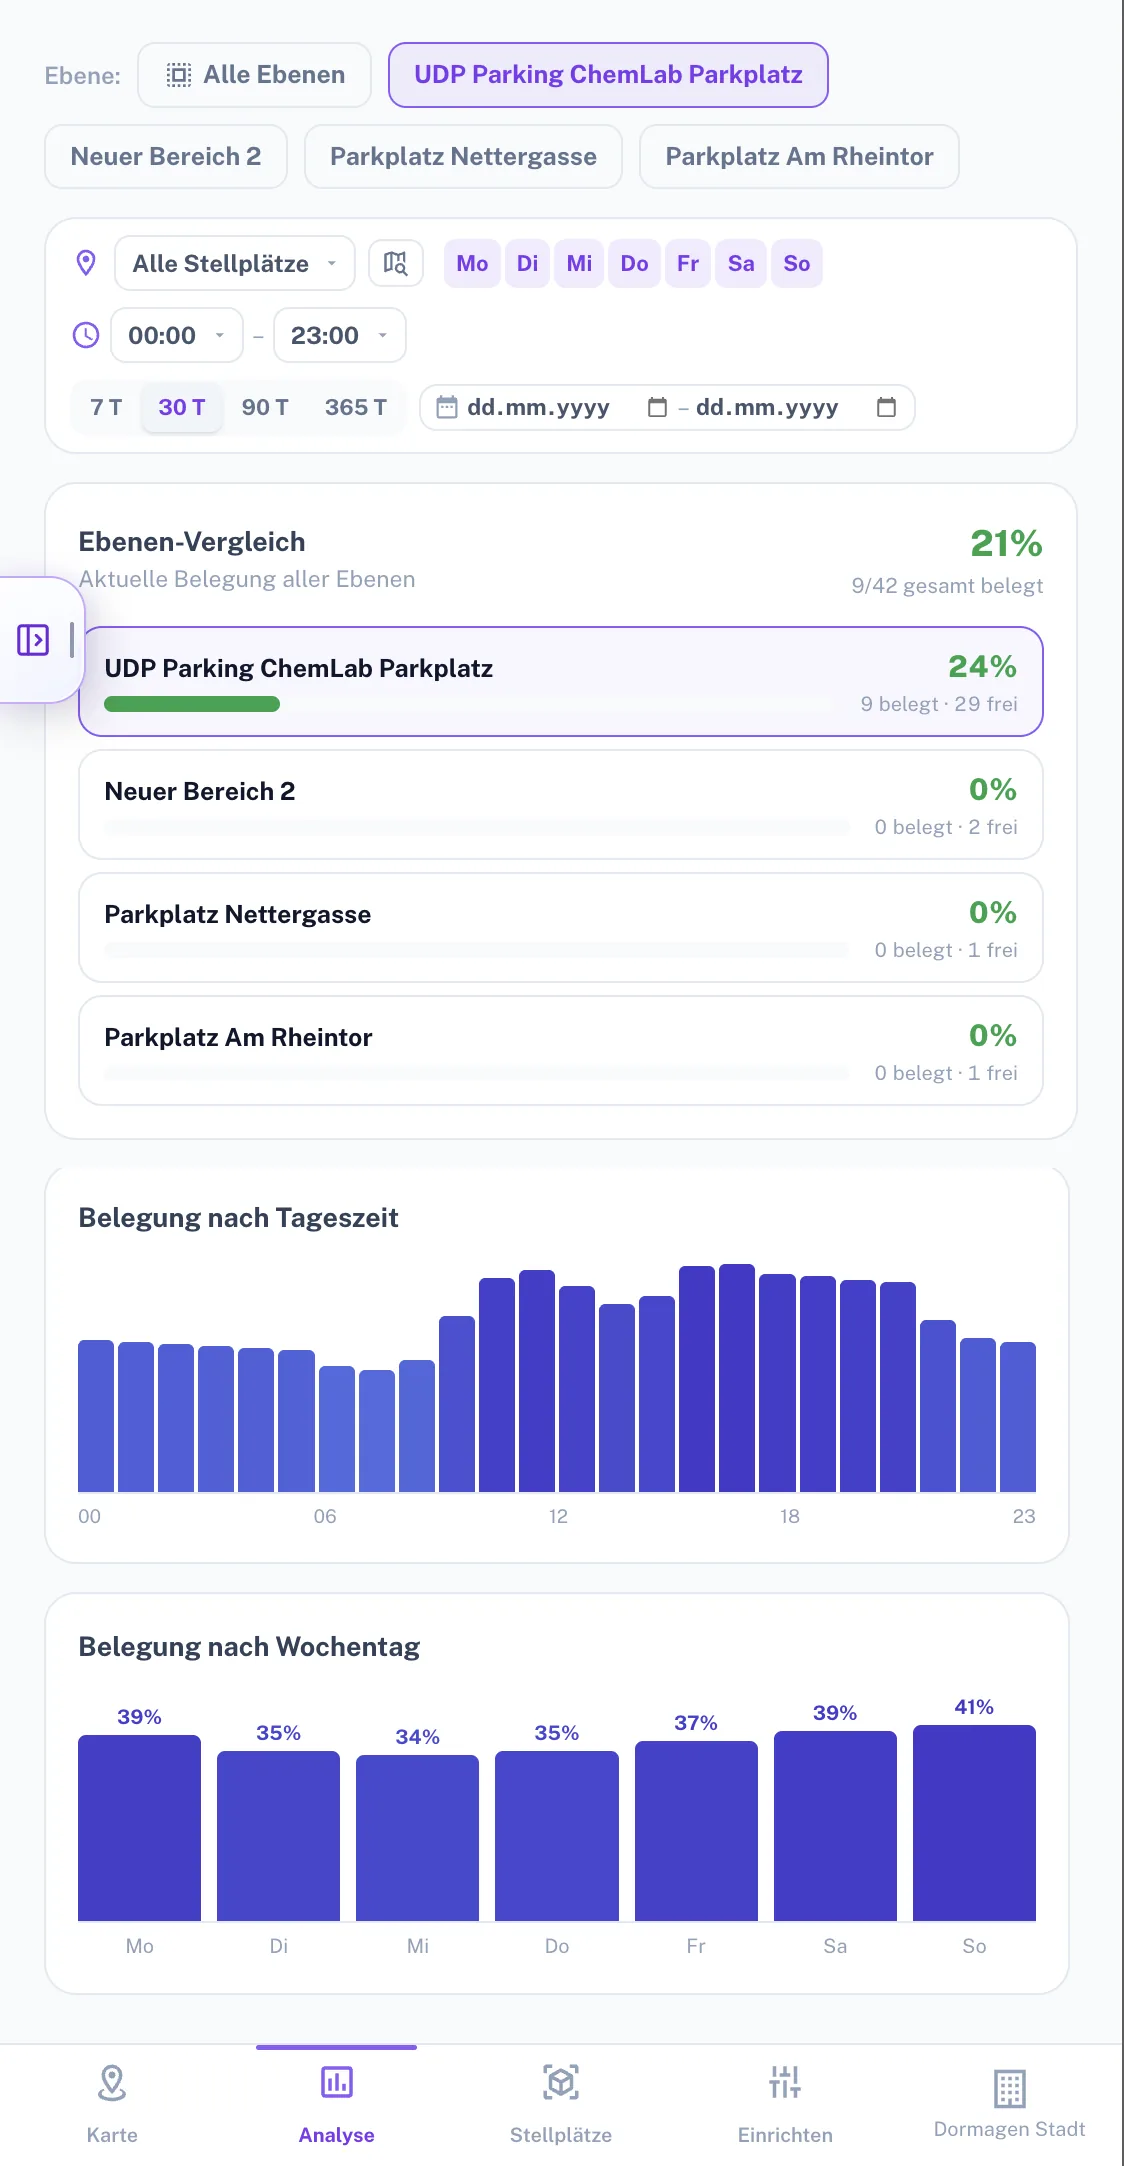
Smart Parking makes parking measurable: live occupancy per zone, vacancy and always-full patterns, monitored special bays — the data foundation your parking decisions were missing.
Opens the parking map in the demo environment — simulated city data, no account needed.
Parking decisions in most cities are made by gut feeling: nobody knows which zones are chronically full, which sit empty, whether the disabled bay is actually free. Smart Parking measures it — and turns parking policy into a data question.
Occupancy, vacancy, misuse — until now anecdotes. Smart Parking replaces gut feeling with measured utilization per zone, hour and bay type.
Which zones run full when, which stay empty — live and as a pattern over weeks.
Disabled, e-charging, resident bays: occupancy and misuse per bay type, verifiable.
Guidance to free bays shortens search traffic — measurably less CO₂ and noise.
The real value isn’t the free bay — it’s the pattern behind it: zones that are full at 9 am and dead at 8 pm, e-bays that are never used, resident zones under pressure.
On that data foundation you re-dedicate bays together with traffic planners — evidence-based instead of complaint-based.
Anonymous occupancy detection — no plates, no tracking.
Smart Parking covers the whole chain: see occupancy live, guide drivers, monitor special bays, analyze patterns — and reshape parking with evidence.
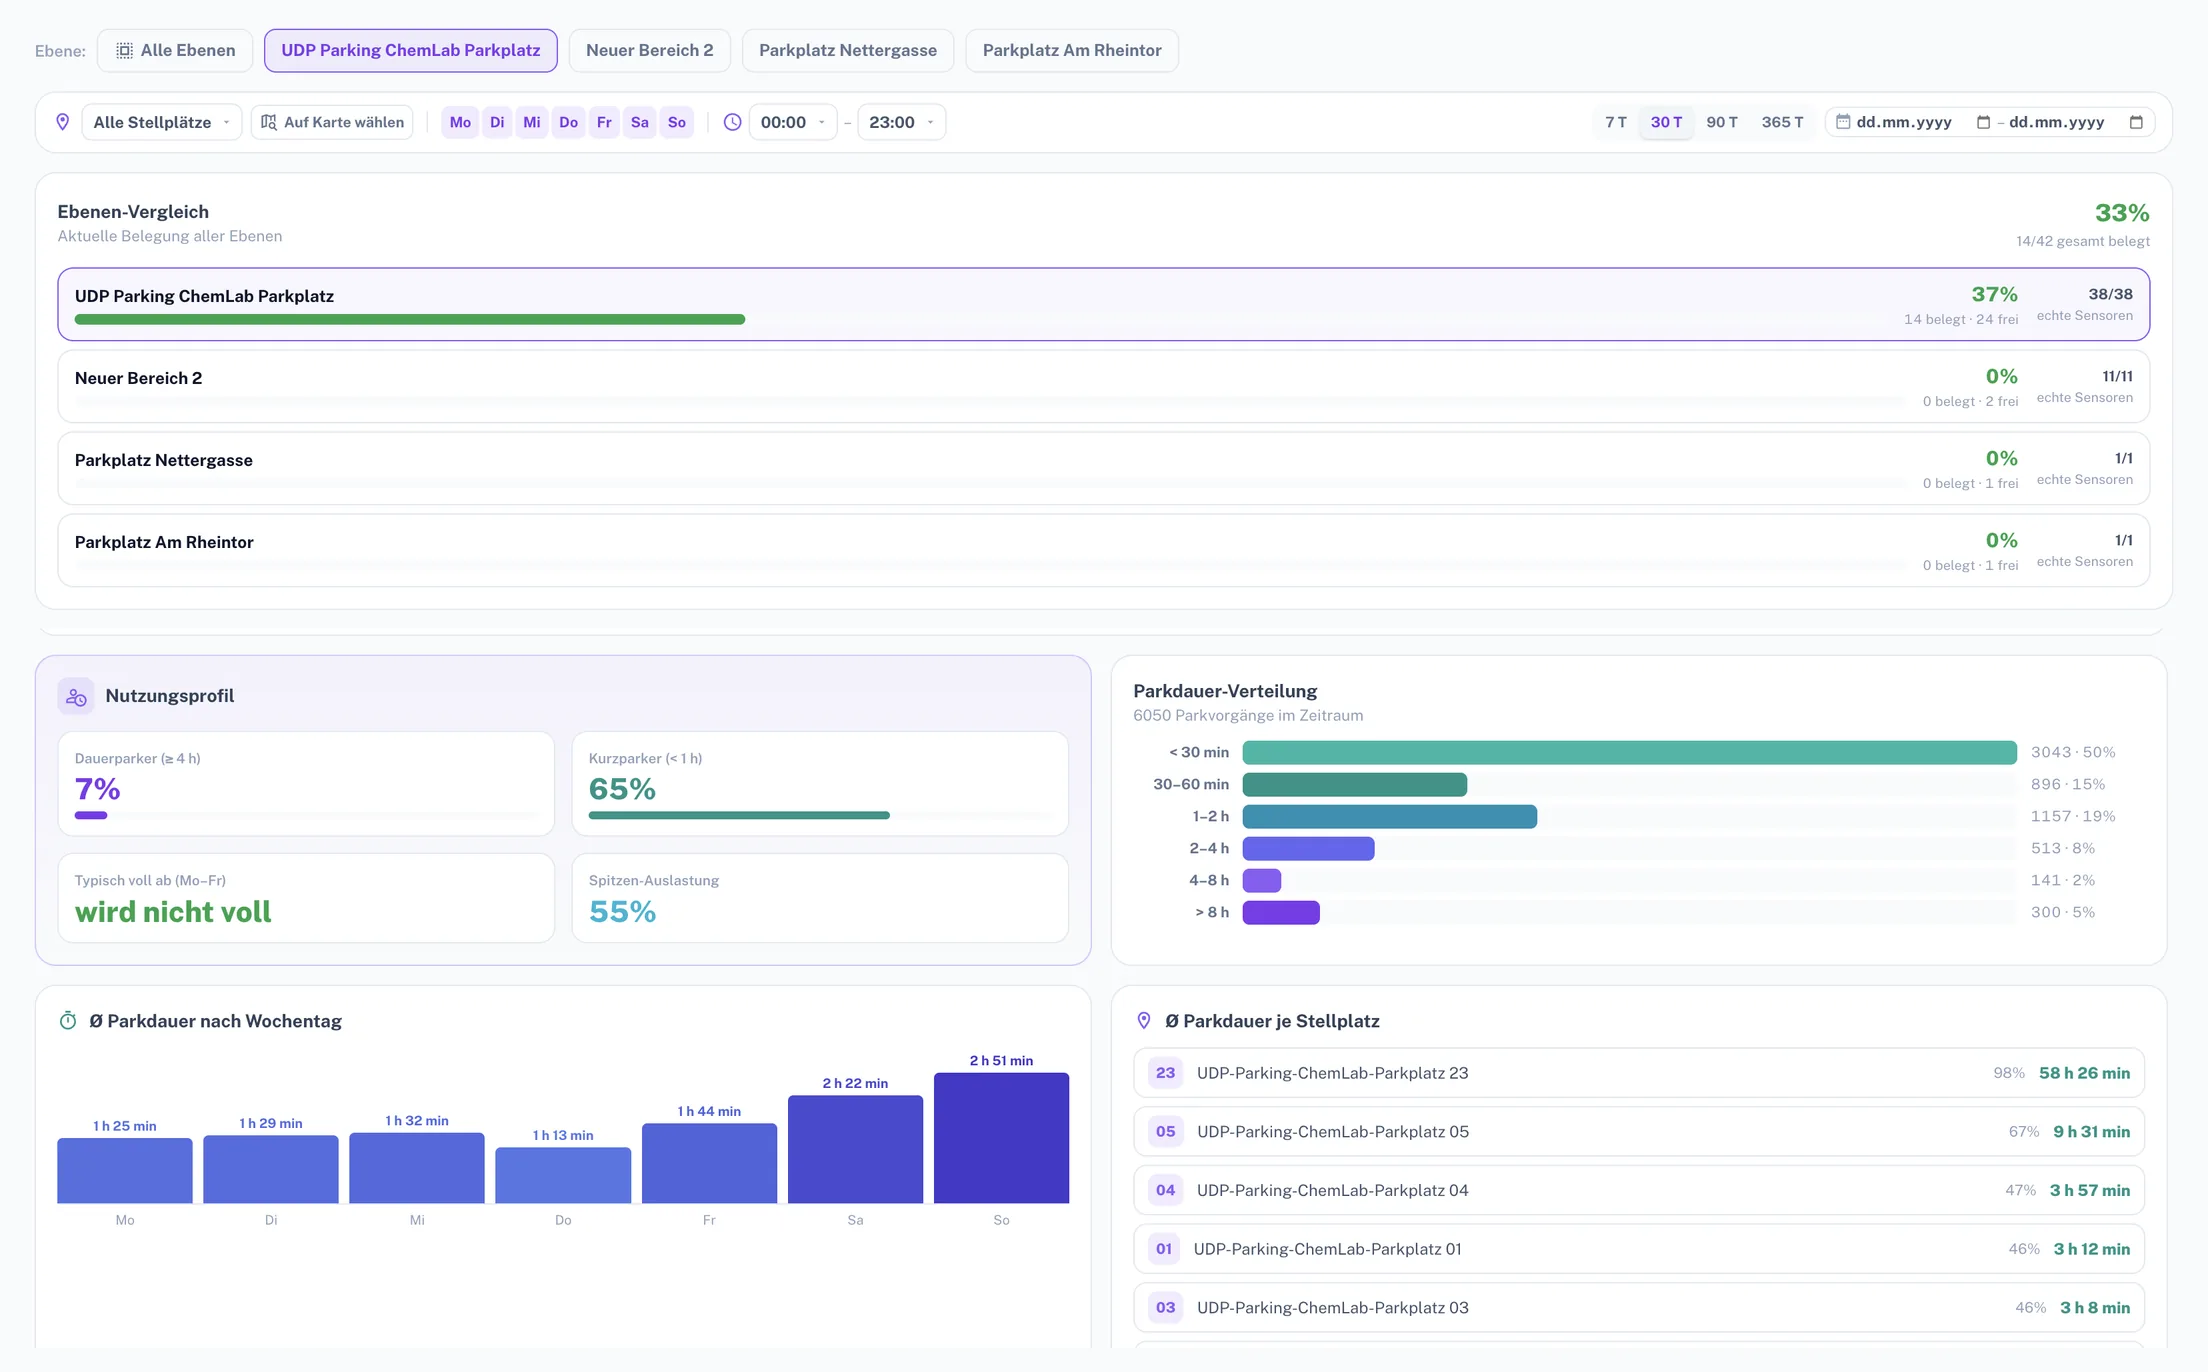
Occupancy by time of day and weekday, area by area: overloaded spaces (review pricing/rules) and vacancy (re-dedicate?) at a glance — the basis for every decision.
Garage, lot and street side by side: which area is how full? Plus the forecast for the next hours and the occupancy trend — so you see bottlenecks before they happen.
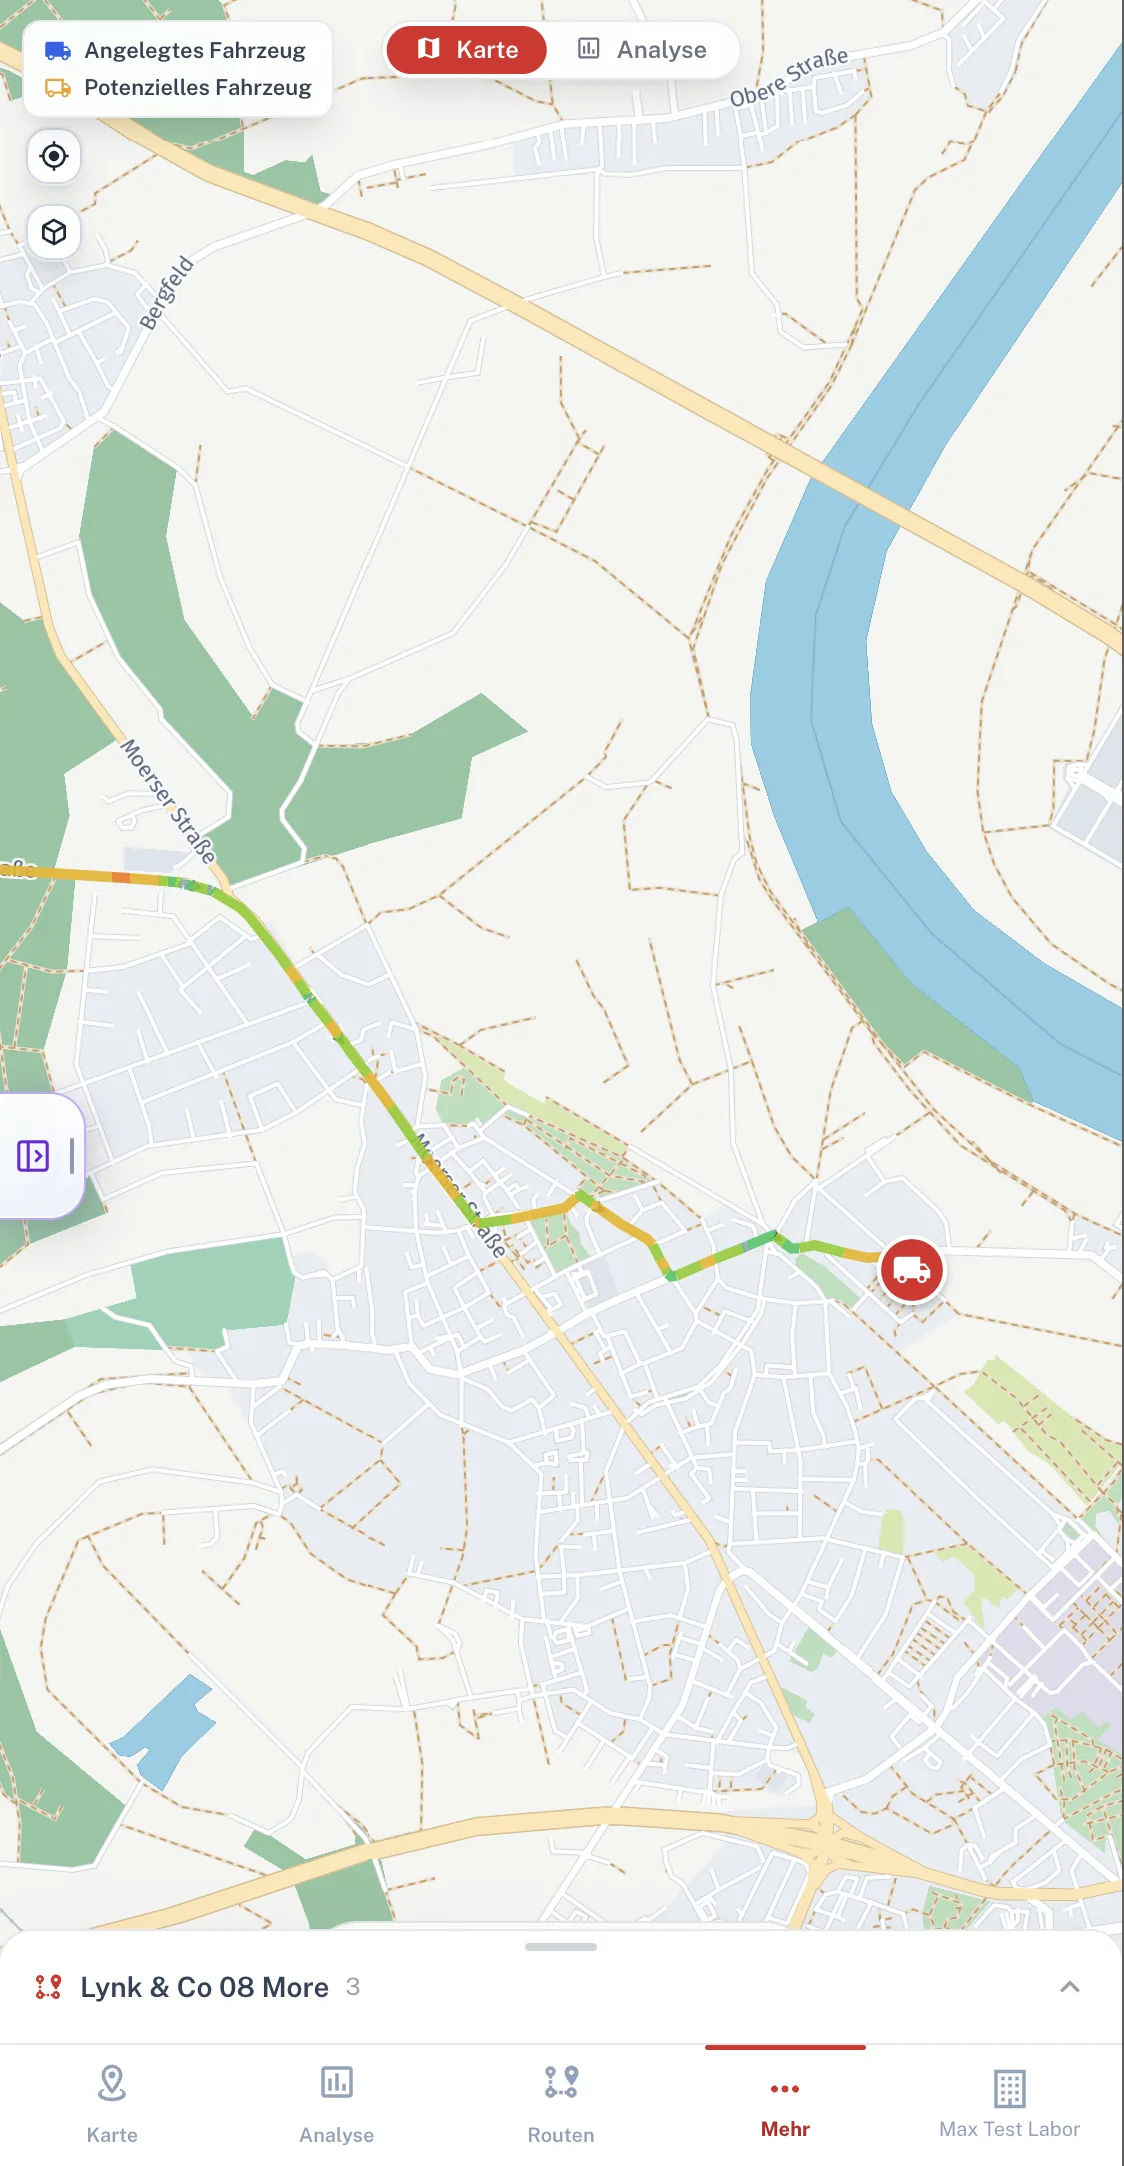
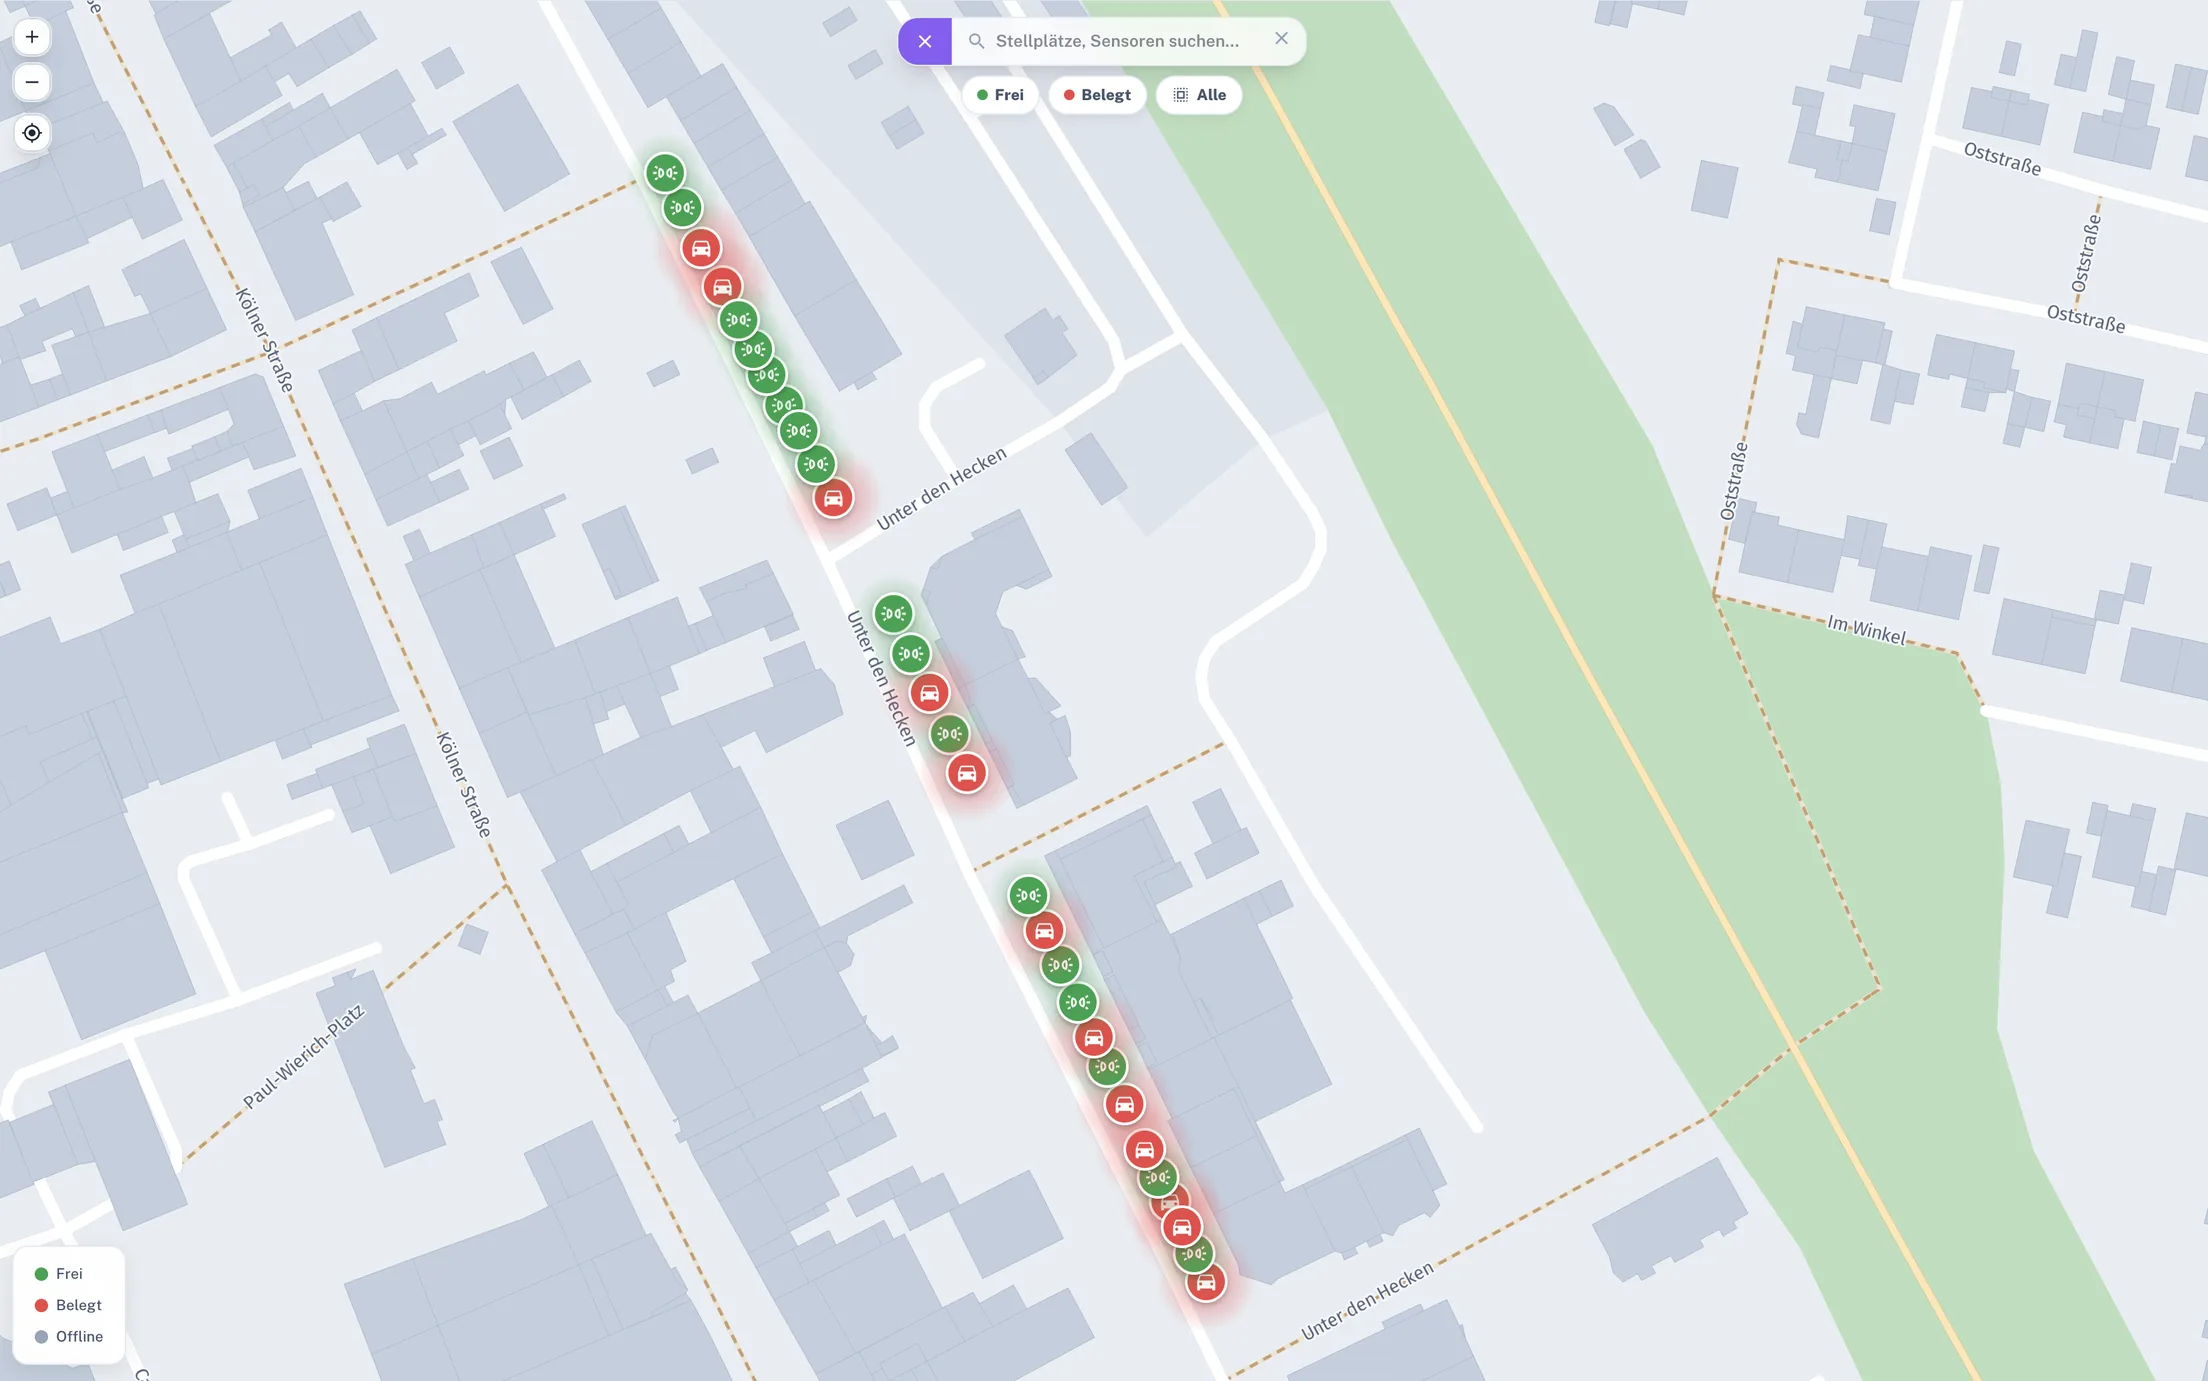
The live map shows every parking bay in real time — free or occupied, on-street, on squares and in the garage.
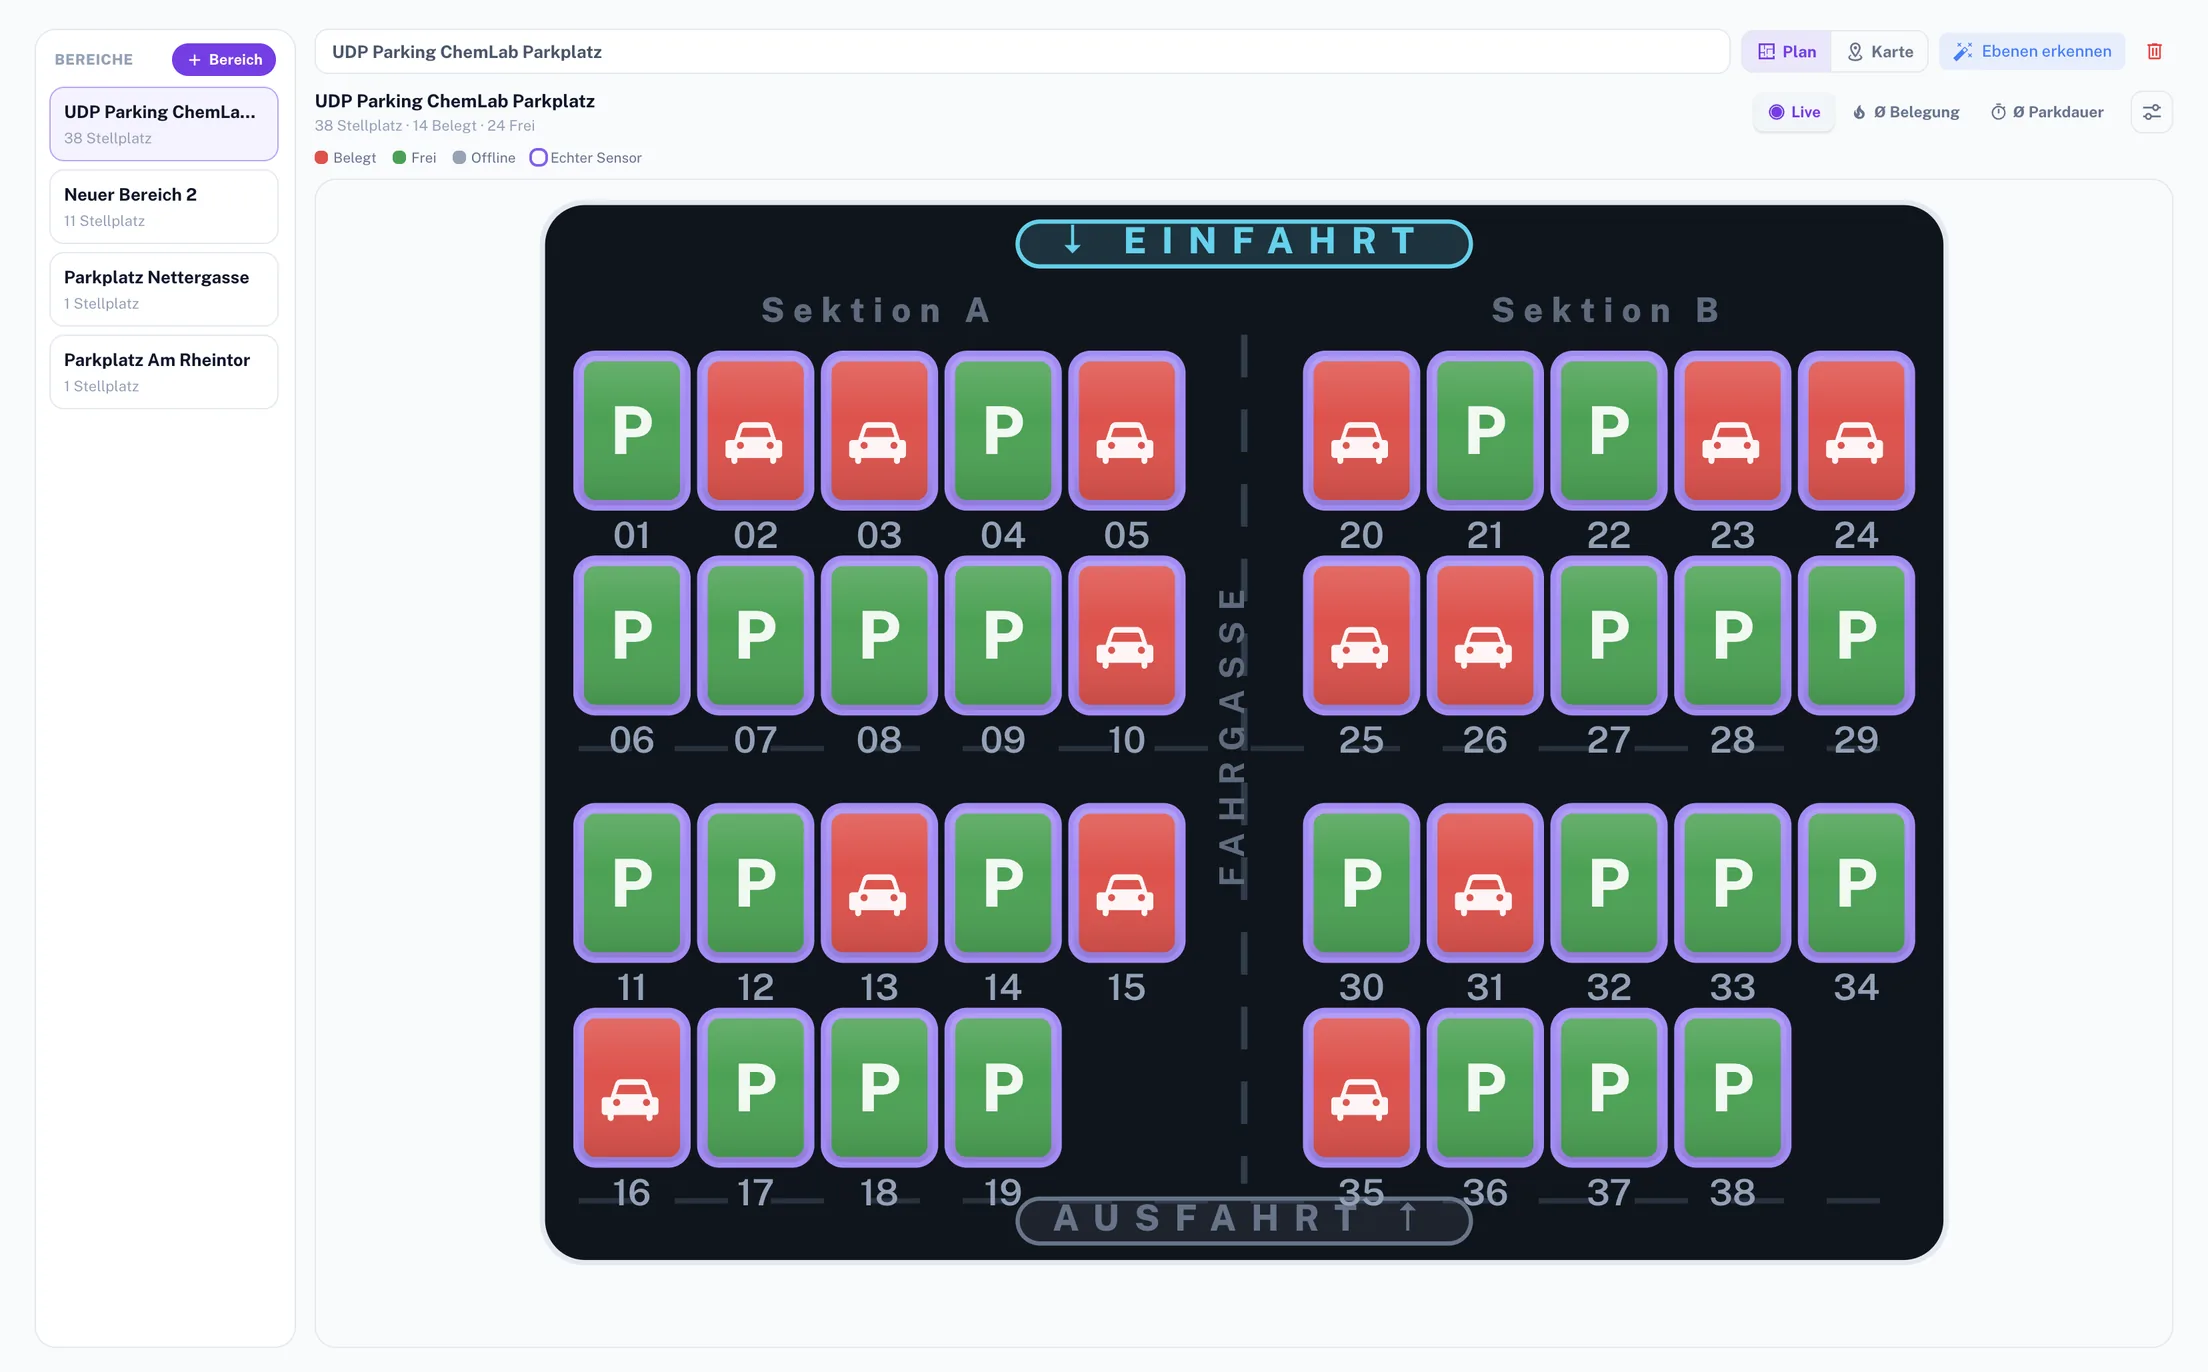
The bay plan shows how long each bay has been occupied. Maximum stay exceeded? Overstays stand out immediately — and the enforcement team knows where to go.
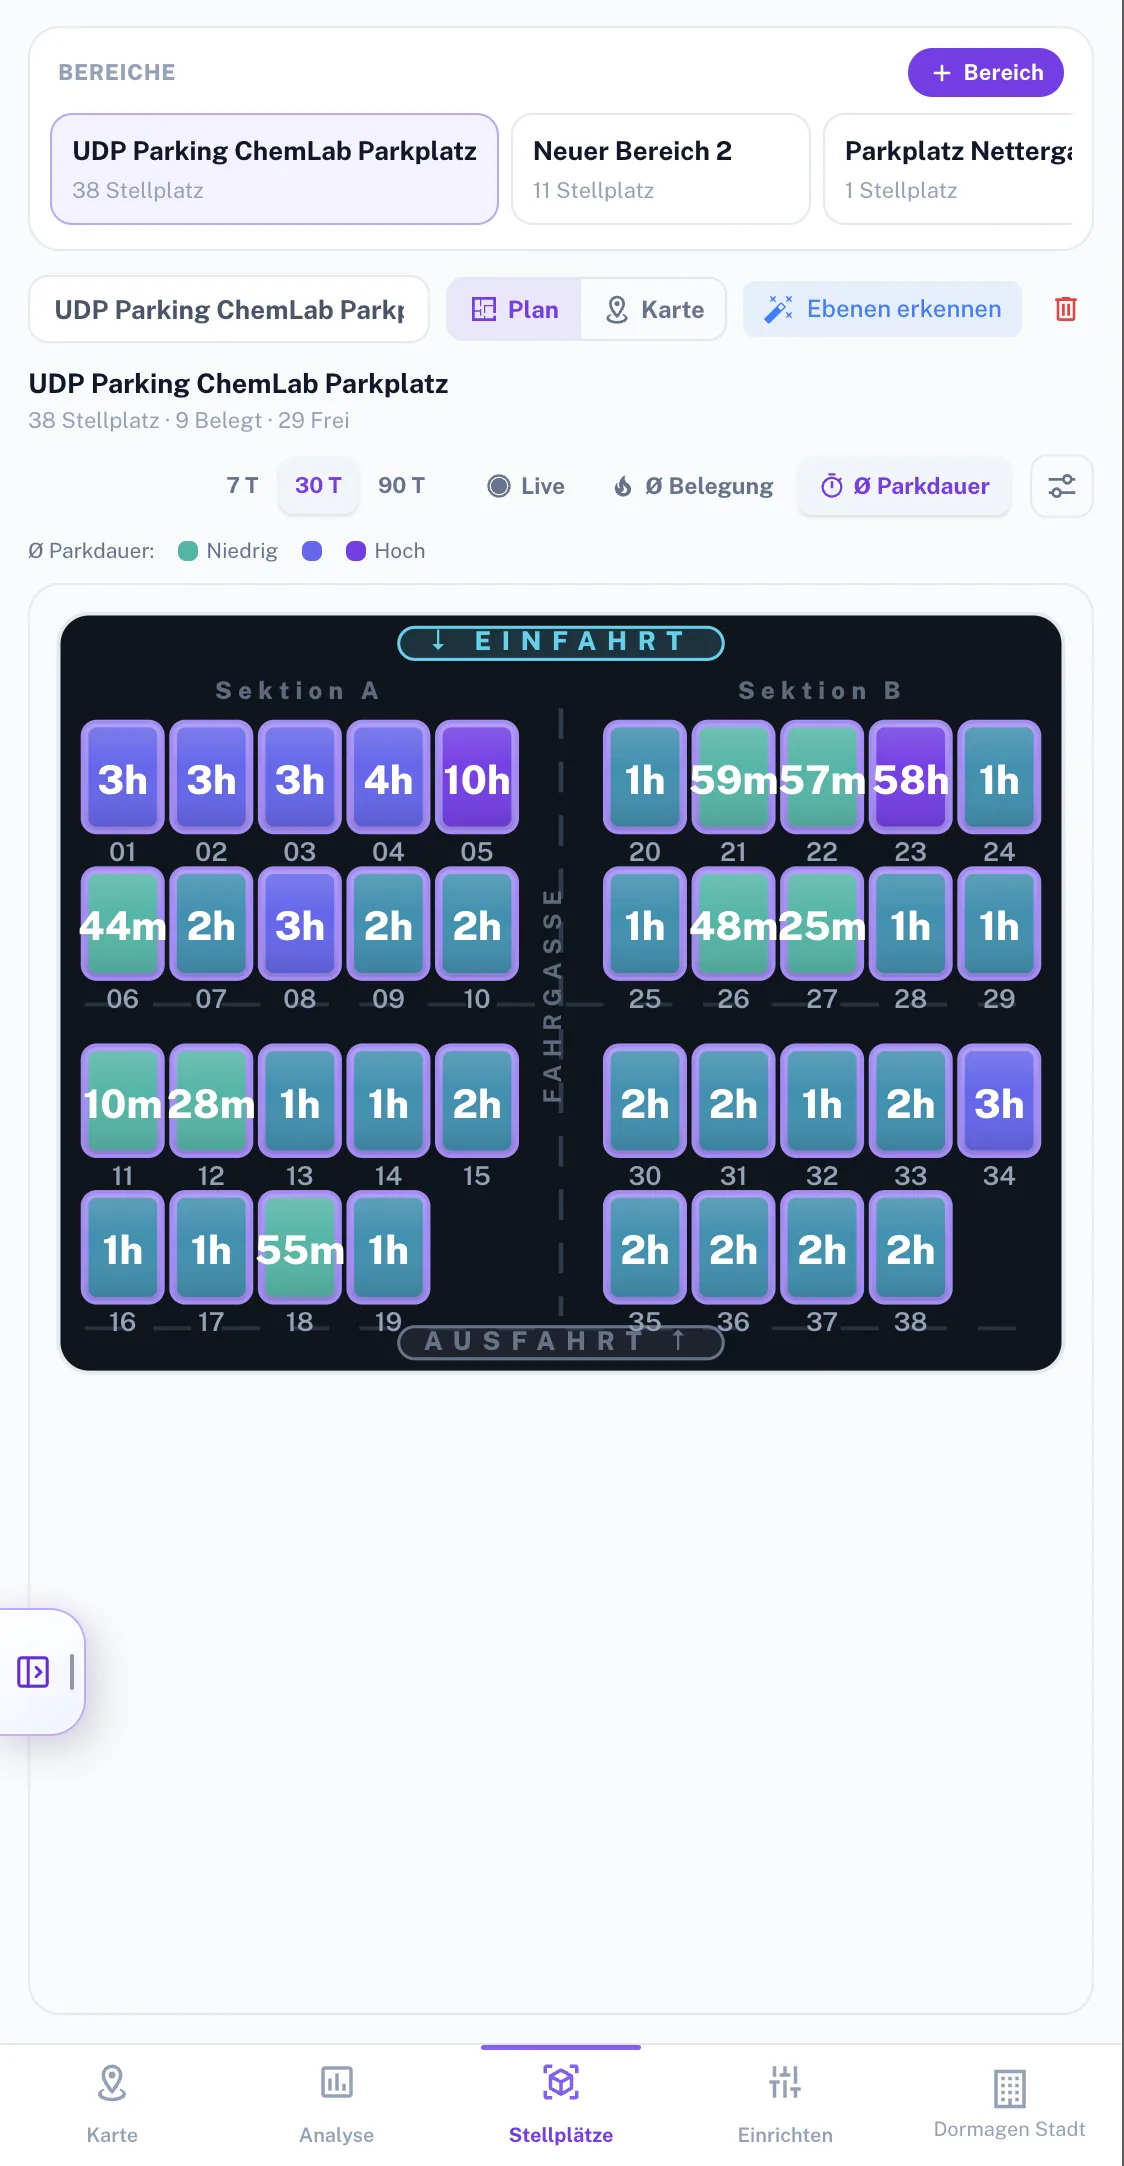
The bay plan maps your lot section by section: free or occupied per bay, plus how often each bay is used — live in the app and at the entrance.
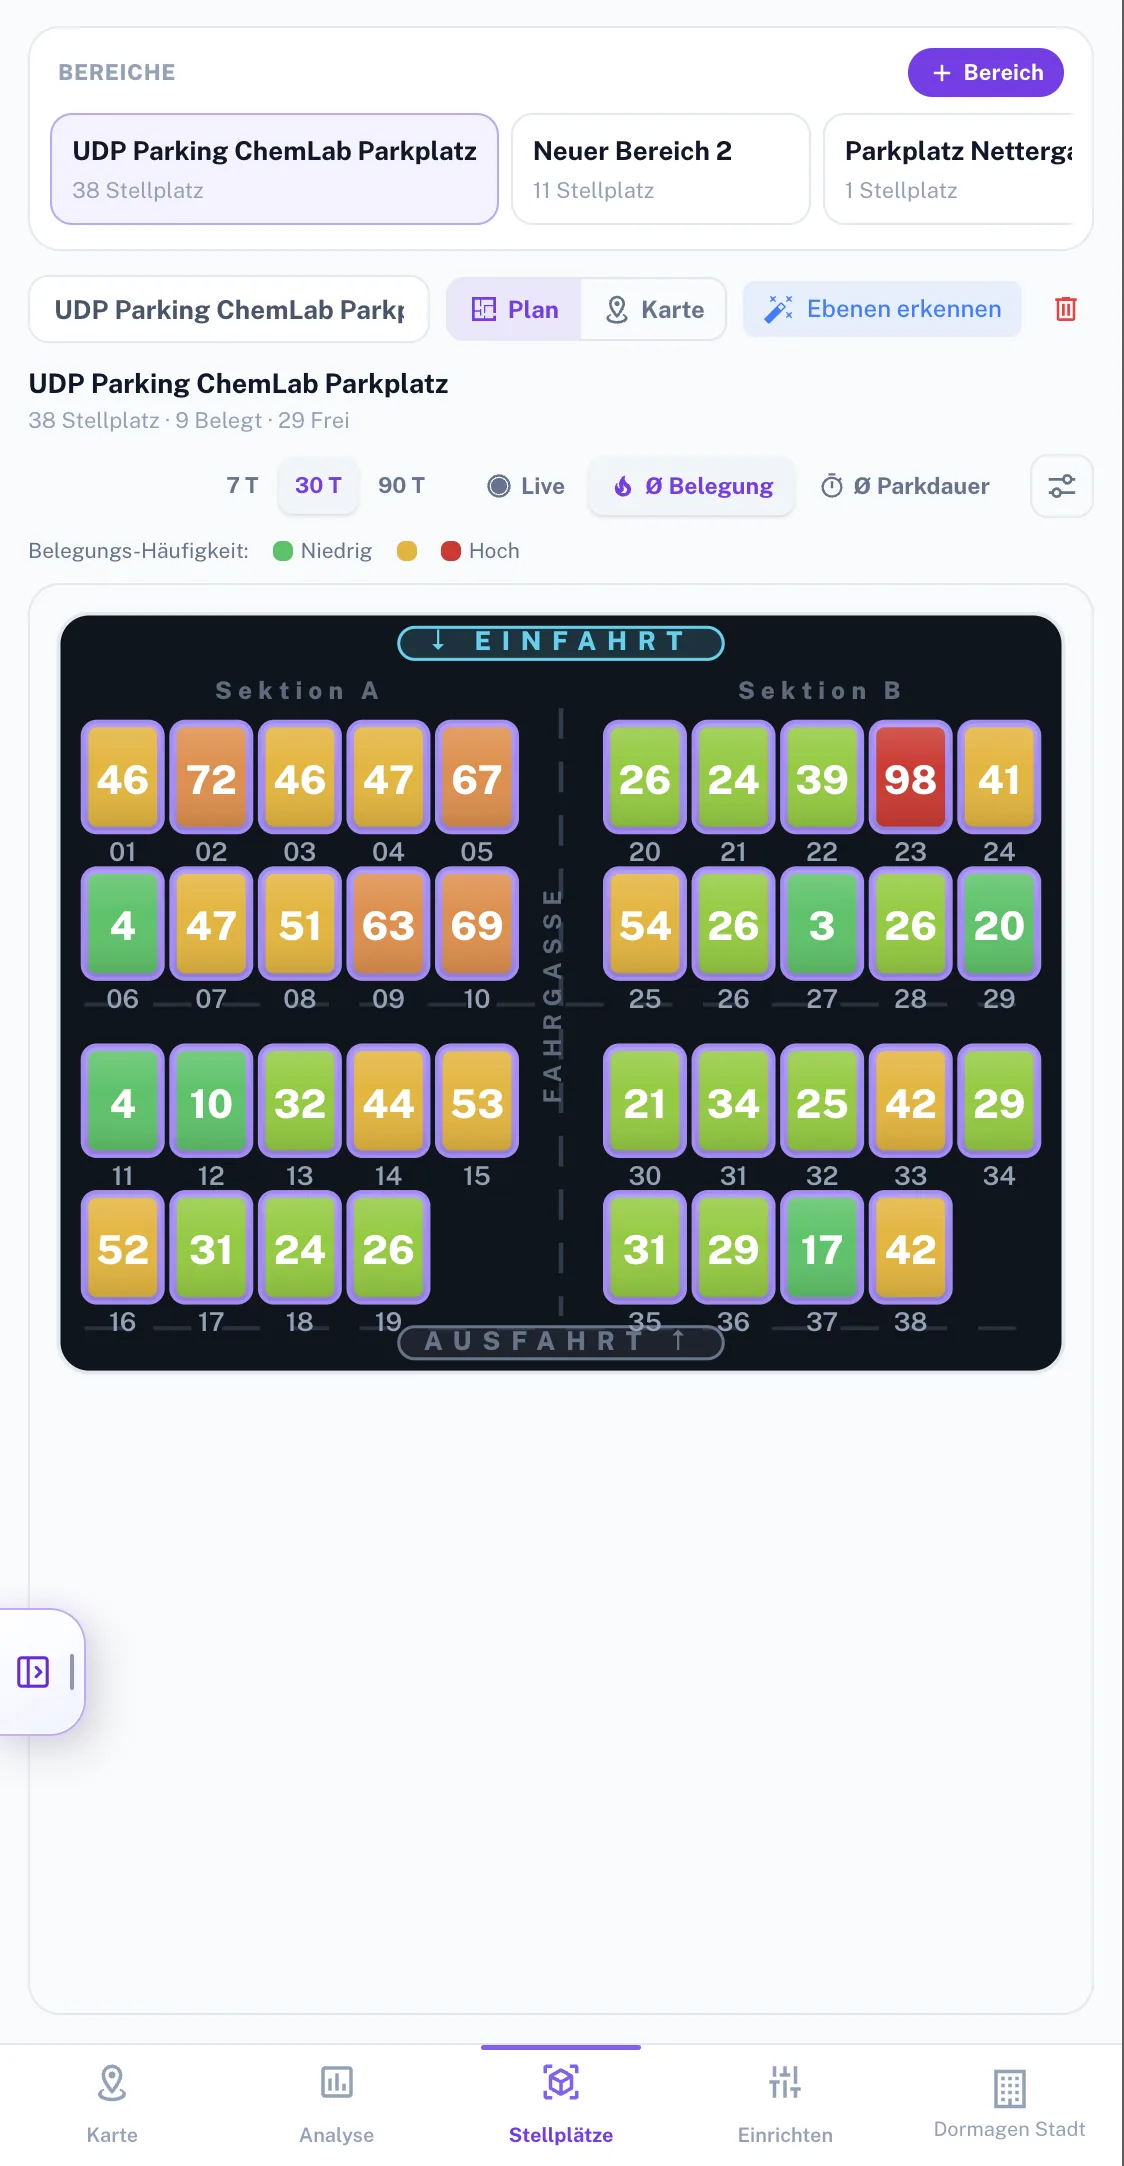
The same parking space, read several ways: the bay plan bay by bay, and utilization by area, time of day and dwell time.
Smart Parking detects occupancy — not people, not plates. What remains is the number: free or occupied.
In-ground sensors and anonymous detection register occupancy only — never who is parking.
No movement profiles, no dwell tracking of individuals — only aggregate utilization per zone.
All data stays on EU infrastructure, in your span of control.
Measurement quality, update frequency and operating life depend on the sensors, configuration and local conditions. Check the technical specifications and actual scope for your deployment. Example values do not guarantee savings.
Anonymous occupancy detection — no plates, no tracking.
Every urbanOS app inherits the platform underneath it. You never buy an island.
GDPR-compliant, ISO-certified, hosted in Germany. Your city's data stays your city's data.
Standard IoT sensors over LoRaWAN and existing networks. Deployment takes days, not months.
Add or remove apps as your city's needs change. The platform and your data stay in place.
Start with one zone: sensors, platform and occupancy map as a package — running in weeks, expandable at any time.
Always includedThe open demo shows the parking map with simulated data: occupancy per zone, special bays, live changes. No account — it’s the same view our cities work with.
Open live demoPrefer a guided tour? Book a live session
Let the AI you trust walk you through Smart Parking and its concrete value for your municipality — tailored to your role and your city.
Opens your AI in a new tab with a prepared question. You can edit it before sending.